Richard Weller uncaps a black marker, tears a piece of paper from a pad and sketches an organic blob. “So, this is a city,” he begins. “And then, let’s say, there are endangered species living here (blot!) and here (blot!) and maybe here (blot!). If we can predict this city is growing in these (arrow! arrow! arrow!) directions, then that’s (circle!) going to be a problem, and so will that (circle!).”
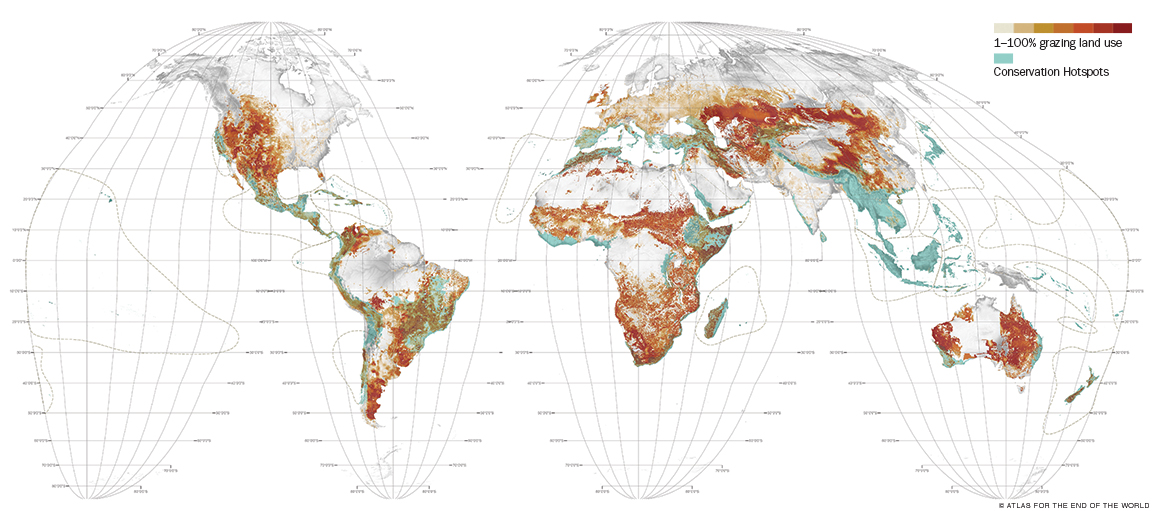
Urbanization and a rising demand for food production—which frequently leads to deforestation—are twin forces buffeting the world’s richest and most threatened biologically diverse regions, or “hotspots,” says Weller, the Martin and Margy Meyerson Chair of Urbanism and a professor and chair of the landscape architecture department.
“Conservation is a third force, though, and it’s pushing back, trying to salvage these bits of genetic heritage,” he continues. Such is the tension between these forces that in 1994 the United Nations issued a formal goal of protecting 17 percent of the world’s terrestrial habitat—land and inland water areas—by 2020.
With three years remaining, Weller wondered, how are we doing?
To answer that question, he enlisted two recent graduates, Claire Hoch LAr’14 and Chieh Huang LAr’15, to help him examine multitudes of tables, charts, and satellite images. They turned the data into a cohesive narrative and released the result—the visually rich, Web-based Atlas for the End of the World—on Earth Day.
“We were a shoestring operation conducting a global audit,” Weller says. “We gave ourselves the brief of using design to reconcile the tensions between economics and conservation in these territories,” he continues. “Throughout modernity, we’ve held a dualistic view: the city as one thing and nature as something else. We now understand the world as a complex synthesis of cultural and natural systems. That presents a new design problem.”
The Atlas focuses on 36 hotspots—which range from Brazil’s Atlantic forest (8 percent protected), to the California Floristic Province (13.6 percent protected), to the entirety of Japan (19.1 percent protected). The maps break these down into their constituent ecoregions—geographically distinct areas such as grasslands or coastal mangrove forests—and juxtapose them with 422 cities that have a minimum population of 300,000. By merging and layering data from UN agencies and scholars, the maps reveal where urban growth is on a collision course with endangered species and remnant habitat. The upshot is that 21 of the 36 hotspots have yet to meet the UN target.
The atlas also features 44 newly constructed maps that depict instances of ecological concerns like deforestation, nuclear energy, and rising sea level. Elsewhere, “datascapes” attempt to explain quantities that can be hard to grasp. For example, the 3 billion additional people expected to live in cities by 2100 equates to 357 New York-scale cities built between now and then—about one every three months. The atlas also features a quirky collection of photographs by Singaporean artist Zhao Renhui that introduces the reader to creatures and life-forms—from an eight-pound goldfish to square apples—that are the results of human intervention.
For Weller, “it seemed appropriate in an age of globalization to do a study that was global in its reach. One of the big issues at that scale is biodiversity—and that led inexorably to the 36 hotspots.”
In assembling their atlas “for the end of the world,” Weller and the students weren’t really aiming to sound an apocalyptic alarm.
“It’s the end of a particular kind of world that was started with the first atlas, produced by Abraham Ortelius from Antwerp in 1570,” Weller explains. “He laid out the New World for essentially European powers to begin the historical project of exploiting that territory. That’s modernity. We’ve exhausted that territory, we’ve sucked the life out of almost everything. It’s all known, mapped, people have been displaced, ecosystems disrupted. Because we’ve reached that limit, every square foot of land now has to be managed and redesigned so we can create a world that is ideally a synthesis between our productive systems and the Earth’s system.”
Weller’s atlas reveals that, all told, 15.4 percent of the world now consists of protected land. It may seem like we’re doing well—but he is quick to point out that the 1.6 percent shortfall is equivalent to 700,000 Central Parks. “The world is a garden itself, and we’ve been bad gardeners,” he says. The atlas is a wake-up call that exhorts landscape architects, urban planners, and conservation agencies to “bring design intelligence into the global conversation about land use,” he says. “It’s currently dominated by developers and scientists.”
To help spur that approach, the team plans demonstration projects in each hotspot.
“These scenarios represent tradeoffs and negotiations,” Weller says. “They allow cities to grow and economies to develop while pushing back with significant landscape-conservation aspects.”
So, maybe the world won’t end?
“If we begin designing cities that are more sophisticated ecological organisms, I’m hopeful that we have a chance,” he concludes.
—JoAnn Greco


The author assumes that the highest value is biodiversity. He does not justify his assumption. Some try, unsuccessfully, to justify such an assumption by saying that we don’t know what dire consequences will happen if human beings decrease the current biodiversity. There is no data to support such a justification. We also don’t know what dire consequences will happen if we do not decrease the current biodiversity. My friends at the EPA say that hundreds of species die off every year from natural causes — without any harm being done. They say that the dying off is just part of the survival of the fittest.