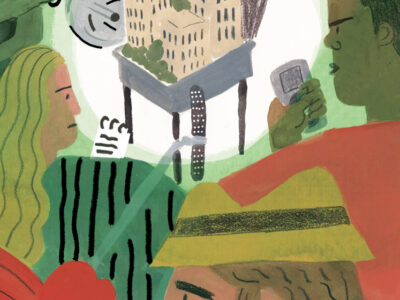
In the summer of 1896, an untenured and underpaid Penn sociologist went door-to-door in Philadelphia’s Seventh Ward, asking questions of African Americans and writing down the answers. U.S. Census takers would do something similar only a few years later, but W. E. B. DuBois’ project was different. He was studying the people of what would later be known as West Center City because he believed that better information on how “Negroes” lived would help improve their circumstances.
At the time, DuBois was only an “assistant” in sociology at the University, not even an assistant professor, despite the fact that he had studied at Harvard University and at the University of Berlin with one of the founders of modern social science, Max Weber. His book, The Philadelphia Negro, would become a landmark in the history of sociology, and of race relations in the United States.
The book was republished by the Penn Press in 1996, and now Penn researchers are using DuBois’ carefully collected data and Geographic Information Systems (GIS) technology to reconstruct the neighborhood he studied and ask new questions of it.
“We think that GIS could bring the book to life,” says Amy Hillier, director of The Philadelphia Negro GIS Project and research director of the Cartographic Modeling Laboratory at Penn (cml.upenn.edu). Collaborating with her is Ben Berman, a senior in urban studies whose work is part of the Penn Institute for Urban Research. DuBois’ attention to detail permits Hillier and Berman to make his data more accessible to a wide range of students and researchers and to link it to other relevant information—everything from fire-insurance maps to the U.S. Census.
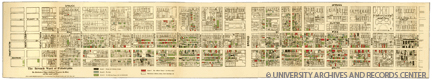
GIS is a way of looking at information that takes into account its location in space. In Philadelphia, for example, the Police Department uses GIS to study the locations and times of crimes and look for patterns. Reports of auto thefts clustered in a single place might lead police to an address where stolen cars are being dismantled for parts. Penn researchers use GIS in a variety of fields. At a spring-semester meeting of the Penn GIS Users Group, Hillier and Berman presented the Philadelphia Negro Project to a group that included biologists, landscape architects, sociologists, archivists, social workers, archaeologists, and librarians. The multilayered city maps, newly coded with DuBois’ information and data collected by the 1900 census, allowed the audience to see that each house in the narrow rectangle of city blocks from Spruce to South streets, and 7th to 23rd streets, was colored according to the “grade” that DuBois had assigned to the people living in it.
These ranged from “Grade 1: The ‘Middle Classes’ and those above,” who had steady incomes and might even own property, to “Grade 4: Vicious and Criminal Classes,” who were not merely renters, but committed acts both immoral and illegal. DuBois took care to define his classes, but his presentation of the study leaves out some of the details. For example, he used a single designation for each house in the 7th Ward. Berman pointed out that in a single house on Lombard Street, no fewer than four family units are represented. The combination of young families and boarders meant that large numbers of unrelated people might all live under a single roof, especially in the same multistory rowhouses of the major streets.
Berman and Hillier’s work allows scholars and other curious sorts to check DuBois’ classification of all of the houses into these four categories against the results of the 1900 census, which includes such facts as occupation, age, and place of birth. These details help flesh out DuBois’ grades, while at the same time keeping that information in the form of a map, where spatial patterns can be observed and analyzed. A useful spatial pattern that can be discerned when the GIS is used with census data is whether or not groups of migrants from particular places maintained discrete communities within the neighborhood. The turn of the century was the beginning of the Great Migration of African Americans from the South to the cities of the North, and this kind of fine-grained data is not easy to come by, Hillier says.
The main reason data that is so plentiful in the library is so scarce in GIS and other databases is that in order to be analyzed, all of the census results have to be painstakingly entered into a form the computer can manipulate.
Ultimately, all of their findings will be published on the Internet, so that scholars and especially students will have access to it. The Philadelphia Negro is a classic of urban sociology, but having the ability to analyze the data on which it is based—by looking at every person within every house in the neighborhood—changes the student’s experience, Hillier says. Instead of relying only on DuBois’ judgment, it will be possible to reanalyze the neighborhood he studied, and reach independent conclusions.
—John H. Walker Gr’99